
Figure 1.
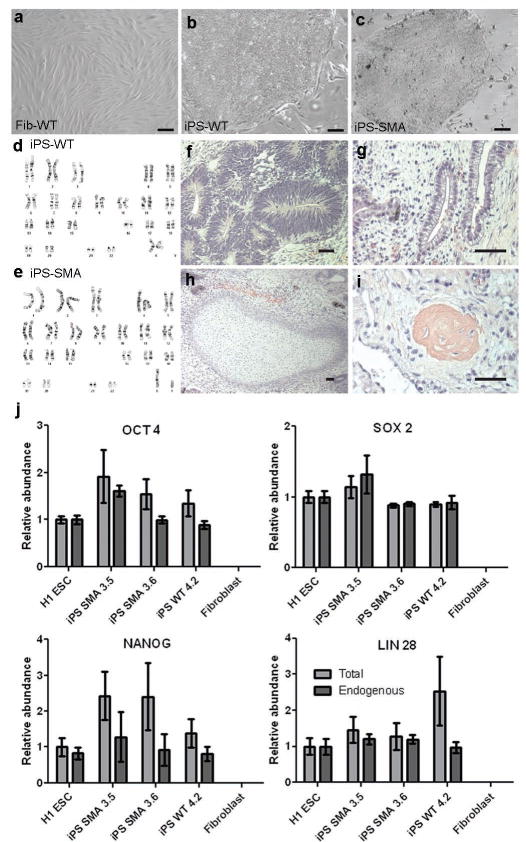
Newly generated iPS cells were fully reprogrammed. a-c, iPS-WT and iPS-SMA cells formed tightly packed colonies in contrast to the spindle morphology of fibroblasts. d,e, No karyotypic abnormalities were observed. Following transplantation, all iPS cells generated teratomas showing f, neural tissue (ectoderm), g, primitive gut (endoderm), h, cartilage (mesoderm), and i, bone (mesoderm). j, Quantitative RT-PCR showed induction of endogenous transcripts of OCT 4, SOX 2, NANOG, and LIN 28. “Endogenous” refers to primers recognizing the 3′ untranslated region, whereas “Total” identifies both the endogenous and exogenously expressed transgene. Data are expressed as mean ± s.e.m. Scale bar = 50μm