
Figure 4.
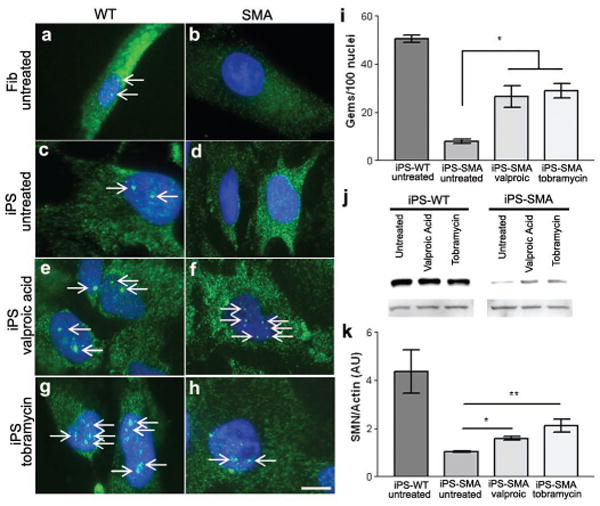
iPS-WT and iPS-SMA cells increase SMN protein in response to drug treatment. a,c, Untreated Fib-WT and iPS-WT cells show nuclear gem localization, whereas b,d, untreated Fib-SMA and iPS-SMA lack nuclear gems. f,h,i, Following valproic acid or tobramycin treatment, iPS-SMA cells show a significant increase the number of gems (ANOVA, p<0.05). Gems are indicated by arrows. j,k, Western blot analysis following valproic acid or tobramycin treatment showed a significant 2-3 fold increase in SMN protein in iPS-SMA cells compared to iPS-SMA cells (n=3 ANOVA, *p<0.05; **p<0.01). Data are presented as mean ± s.e.m. Scale bar = 50μm.