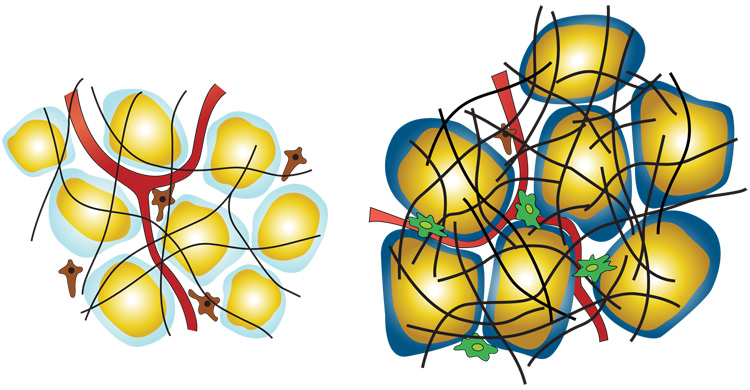
Figure 1. Cartoon representation of white adipose tissue in the lean (left) vs. obese (right) state.
Adipocytes are shown with yellow triglyceride droplets and blue cytoplasm. In the lean state the light blue cytoplasm represent a state of normoxia, whereas the dark blue in the obese state represents a hypoxic state. Pre adipocytes are shown in brown, macrophages in green, blood vessels/endothelial cells in red, and the extracellular matrix as black.

