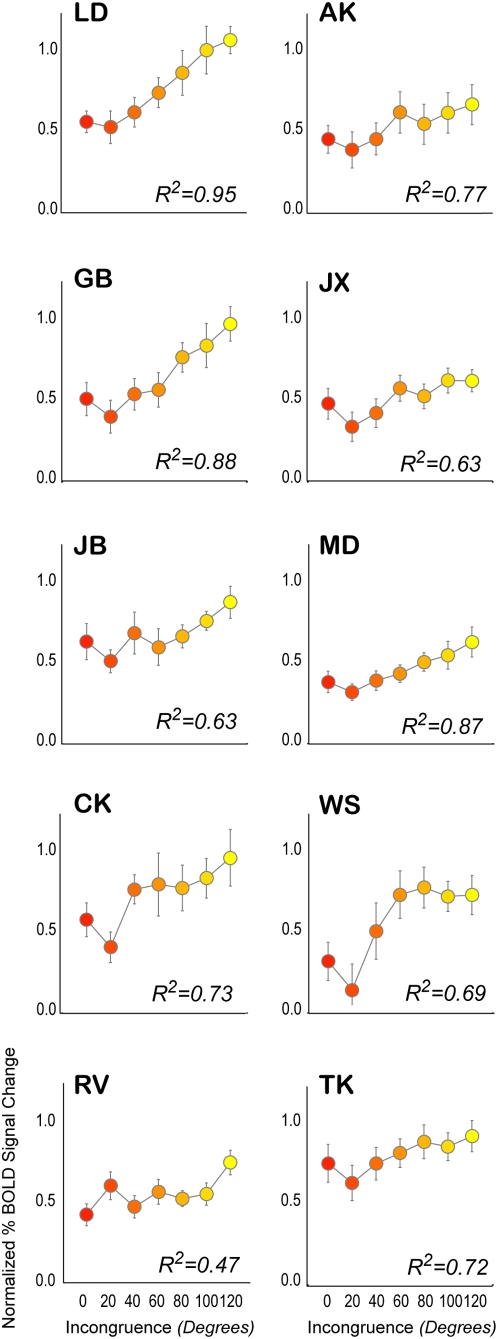
Figure 7. Correlations between incongruence and cortical activation for all individual subjects.
Overall, all subjects show a significant increase in activation for higher incongruencies. However, for RV this increase is somewhat weak. This fits nicely with the psychophysical results: this subject was poor at estimating the level of disparity-defined slant (Fig. 2) and, as a result, the level of incongruence within a stimulus. In addition, the influence of incongruence on alternation rate was also low for this subject. Error bars denote SEM, insets show the statistical result of the linear regression between incongruence and normalized BOLD signal changes, expressed in the fit parameter R-squared.

