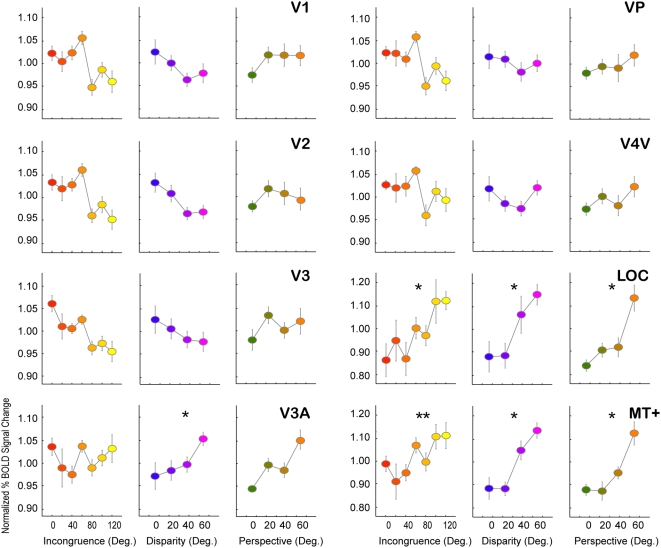
Figure 9. Activation in visual areas.
Analysis of the correlations between stimulus measures (from left to right column incongruence, disparity- and perspective-defined slant) and cortical activation in all localized visual areas (V1,V2,V3,V3A, VP and V4V) as well as area MT+ and LOC. Of these areas, only MT+ and LOC show significant increase in activation for higher levels of incongruence. However, the effect of incongruence in these areas cannot be dissociated from the increase in the level of disparity- and perspective-defined slant, as was demonstrated from the activation within aIPS: similar statistical results were obtained for each measure in these areas. Asterisks denote significant fits between data and measure (p<0.05). Error bars denote SEM.

