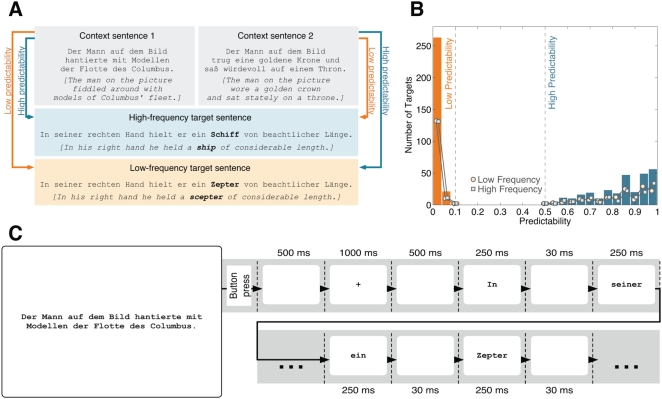
Figure 1. Stimuli and procedure.
(A) Stimulus example. High (ship) and low frequency (scepter) targets were embedded in a neutral sentence frame. Two context sentences triggered low or high predictability of target words. (B) Distribution of predictability values. Bars illustrate the distribution of target predictability across the stimulus material. Low predictability targets (orange) include cloze probabilities no larger than .1. High predictability words (blue) comprise cloze values of at least .5. Lines reflect the dispersion of predictability norms within low (light orange circles) and high frequency (light blue squares) categories. Note that the entire corpus comprises a total of 576 predictability values, since each of the 144 sentence units involves a low and a high frequency target that both serve as low and as high predictability word. (C) Presentation sequence. A context sentence was fully displayed until participants pressed a button. After a fixation cross, the neutral sentence was presented word by word at monitor center. Each word was displayed for 250 ms and followed by a 30 ms blank screen.

