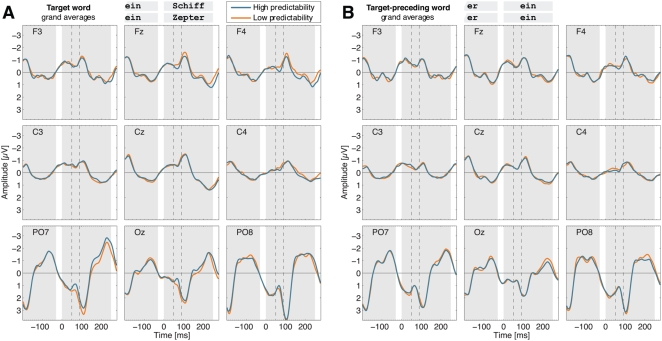
Figure 2. Grand averages for a sample of nine electrodes.
ERPs for low (orange) and high predictability (blue) target conditions when (A) the target word or (B) the target-preceding word was presented. Background shading illustrates the stimulus sequence (gray: word present; white: blank screen). Dashed lines border the interval from 50 to 90 ms.

