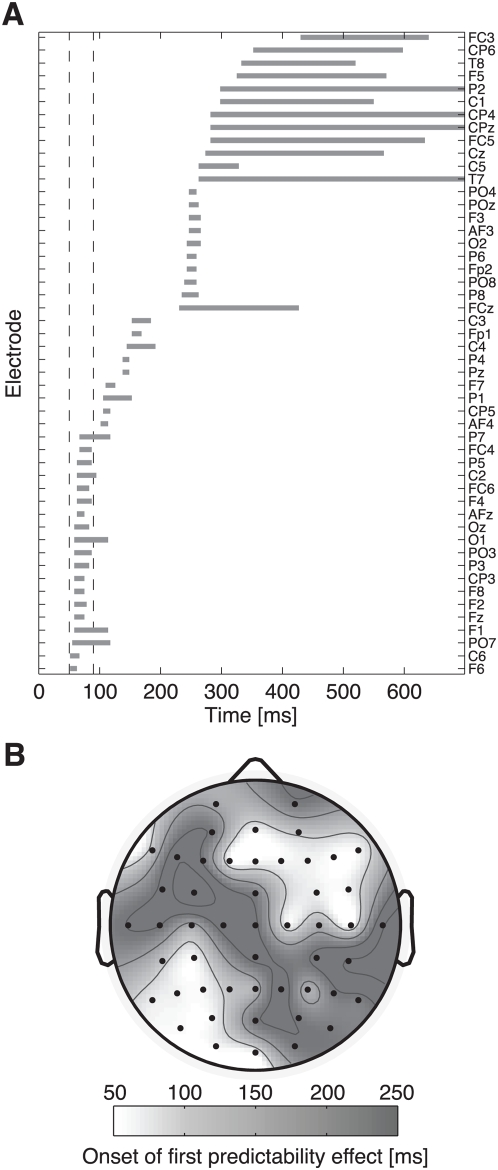
Figure 3. Latencies of the first predictability effect.
(A) Gray bars illustrate onset and duration of the first significant predictability effect on 50 scalp electrodes. In the interval from 50 to 90 ms (dashed lines), the effect emerges on 19 channels. (B) The onset topography reveals early predictability effects at right anterior and left posterior sites.

