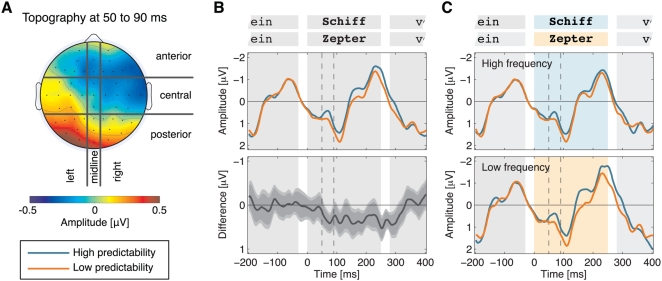
Figure 4. Predictability effect in scalp regions.
(A) Topography of mean amplitude differences (low minus high predictability) in the epoch from 50 to 90 ms. Nine regions of scalp electrodes are delimited by black borders. (B) Mean amplitudes from seven electrodes at the posterior left region. In the interval from 50 to 90 ms (dashed lines), amplitudes are more negative for high (blue) than for low predictability (orange) words. The lower panel shows the difference waveform (low minus high predictability). Mid-gray and light-gray error bands depict 95% and 99% confidence intervals, respectively, computed from 5000 bootstrap samples. Background shading illustrates the stimulus sequence (gray: word present; white: blank screen). (C) Within-frequency class ERPs at the posterior left region. The early effect of predictability is independent from target frequency. Background shading reflects the stimulus sequence (shaded: word present; white: blank screen).

