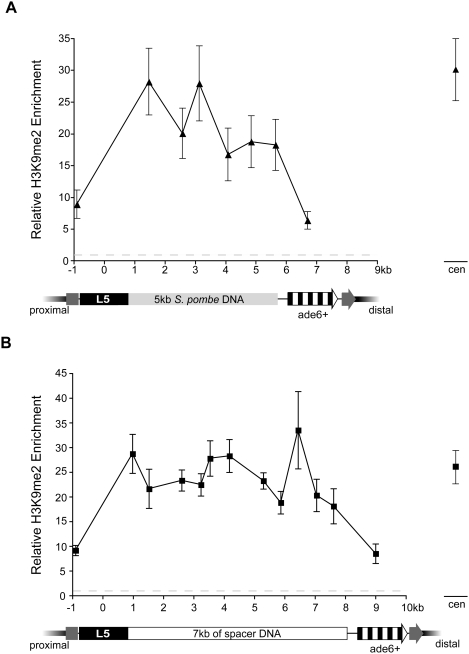
Figure 2. H3K9me2 is highly enriched over intergenic and spacer DNA fragments.
H3K9me2 enrichment is plotted versus S. pombe intergenic DNA as shown in light grey (A) and DNA from the phage lambda as shown in white (B). The dark grey arrow represents the disrupted ura4 gene. The data points on the far right represent the level of H3K9me2 enrichment observed at the pericentromeric repeats in the respective strains, as internal controls.

