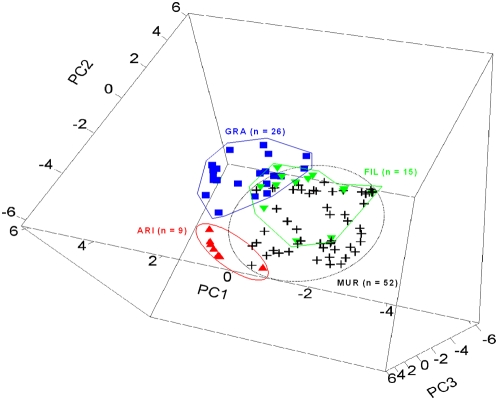
Figure 3. Three-dimensional representation of the variation in aromatic plant species composition of nests between study plots.
Axes are those resulting from a PCA on the log-transformed relative abundances of the 15 aromatic plant species identified in nests (see Methods). Points representing nests from the ‘MUR’ site are located in the back of the figure, whereas points representing nests from the ‘FIL’ plot are in the front of it.

