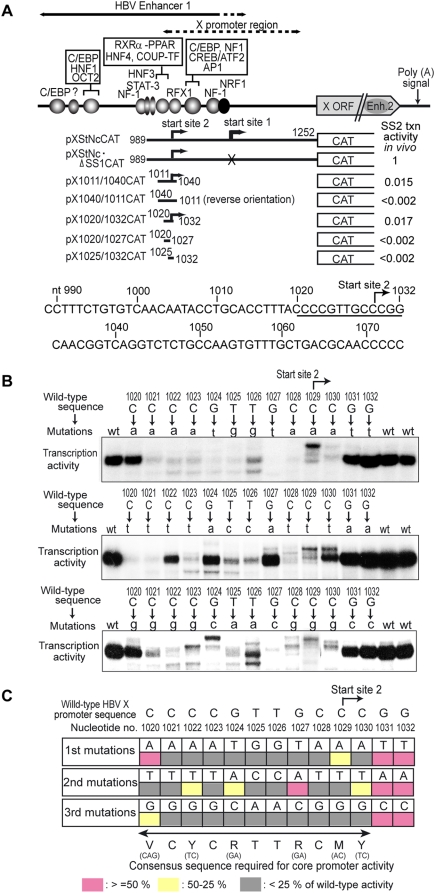
Figure 1. Determination of the core promoter element driving transcription from HBV X mRNA Start site 2.
(A) Schematic of the HBV enhancer 1-X promoter region and the deletion mutants used for mapping of the minimal promoter for transcription from Start site 2. Different HBV enhancer 1-X promoter fragments (nucleotide numbers of the boundaries shown) were cloned into a CAT reporter plasmid and used as the template for in vitro transcription. Summary of the in vitro transcription analyses are schematically shown. The bent arrows show that accurate transcription from Start site 2 [6], [47] was detected with the indicated constructs. Being the same thicknesses of the bent arrows indicate about the levels of transcription detected by in vitro transcription assays. Absence of the bent arrows on the promoter region indicates no detectable transcription from the particular DNA fragments in the right direction. On the right ends, relative transcription activity of each construct in vivo (in transfected HepG2 cells) measured by CAT assay is shown as “SS2 txn activity in vivo”. The template pXStNc·ΔSS1CAT has mutation at the Start site 1 core promoter so that only transcription from Start site 2 can be measured. The DNA sequence around the Start site 2 minimal promoter region is shown at the bottom. The 13-bp minimal promoter region is underlined and the position of Start site 2 is shown by a bent arrow. (B) In vitro transcription assays of the wild-type and point-mutated minimal promoters for the Start site 2. The nucleotides within the 13-bp minimal promoter region were individually mutated into three other nucleotides, and the transcription activity of the mutants was assayed in vitro. Primer extension products corresponding to Start site 2 are shown. The levels of transcription from mutant templates were quantified by phosphor-imager analysis. (C) Summary of site-directed mutagenesis. The in vitro transcription assays were repeated at least three times with several independent preparations of template DNAs, and average activity of each mutant relative to that of the wild-type minimal promoter was calculated. Promoter activities of mutants are categorized into three groups based on their relative activity to the wild-type promoter: pink, ≥50%; yellow, 50–25%; gray, <25%. The consensus sequence deduced from our analysis is shown at the bottom of the figure.

