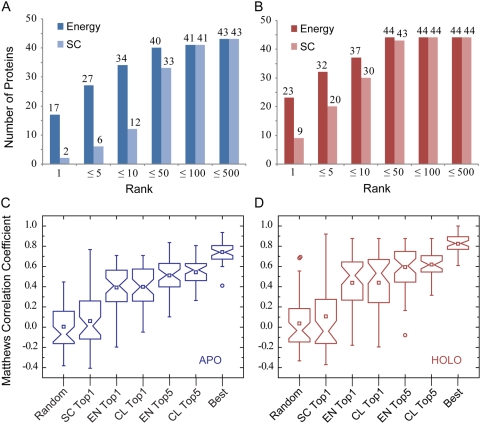
Figure 3. Specific DNA-binding sites versus nonspecific DNA-interacting sites observed in complex models.
Models were built with apo (blue) and holo (red) protein structures. (A,B) Histograms of structures with at least one near-native model at different ranks. The models were ranked according to their interfacial energy or shape complementarity score. (C,D). Each box plot represents the MCCs of DNA-binding protein residue prediction in the APO/HOLO sets. The MCCs were calculated based on models selected from 2500 docking solutions under seven different model selection schemes. The lower, middle and upper quartiles of each box are the 25th, 50th, and 75th percentile; whiskers extend to a distance of up to 1.5 times the interquartile range. Outliers and means are represented by circles and squares, respectively. SC, EN, and CL denote ranking schemes using shape complementarity, energy, and clustering. Top1 and Top5 designate the top model and the best of top five models, respectively. The same notation is adopted throughout this paper.

