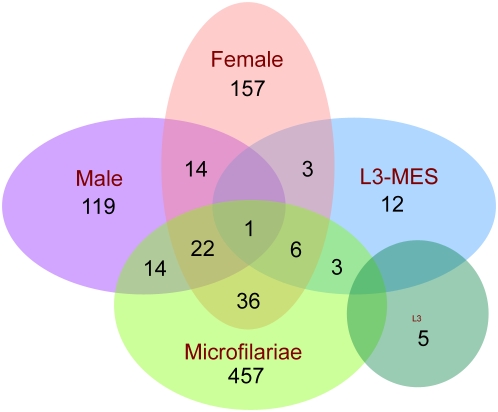
Figure 1. Stage specific distribution of ES in the adults, microfilariae, L3 larvae and L3 larvae molting to L4 of Brugia malayi.
Proteins identified are represented as a Venn diagram, illustrating the overlap in proteins detected in the adult male, adult female, microfilarial and larval stages of B.malayi. The numbers indicate the total number of proteins detected in each of the stages. The complete listing of each of these proteins along with the peptides identified are given in Table S2, Table S3, Table S4, Table S5, and Table S6.

