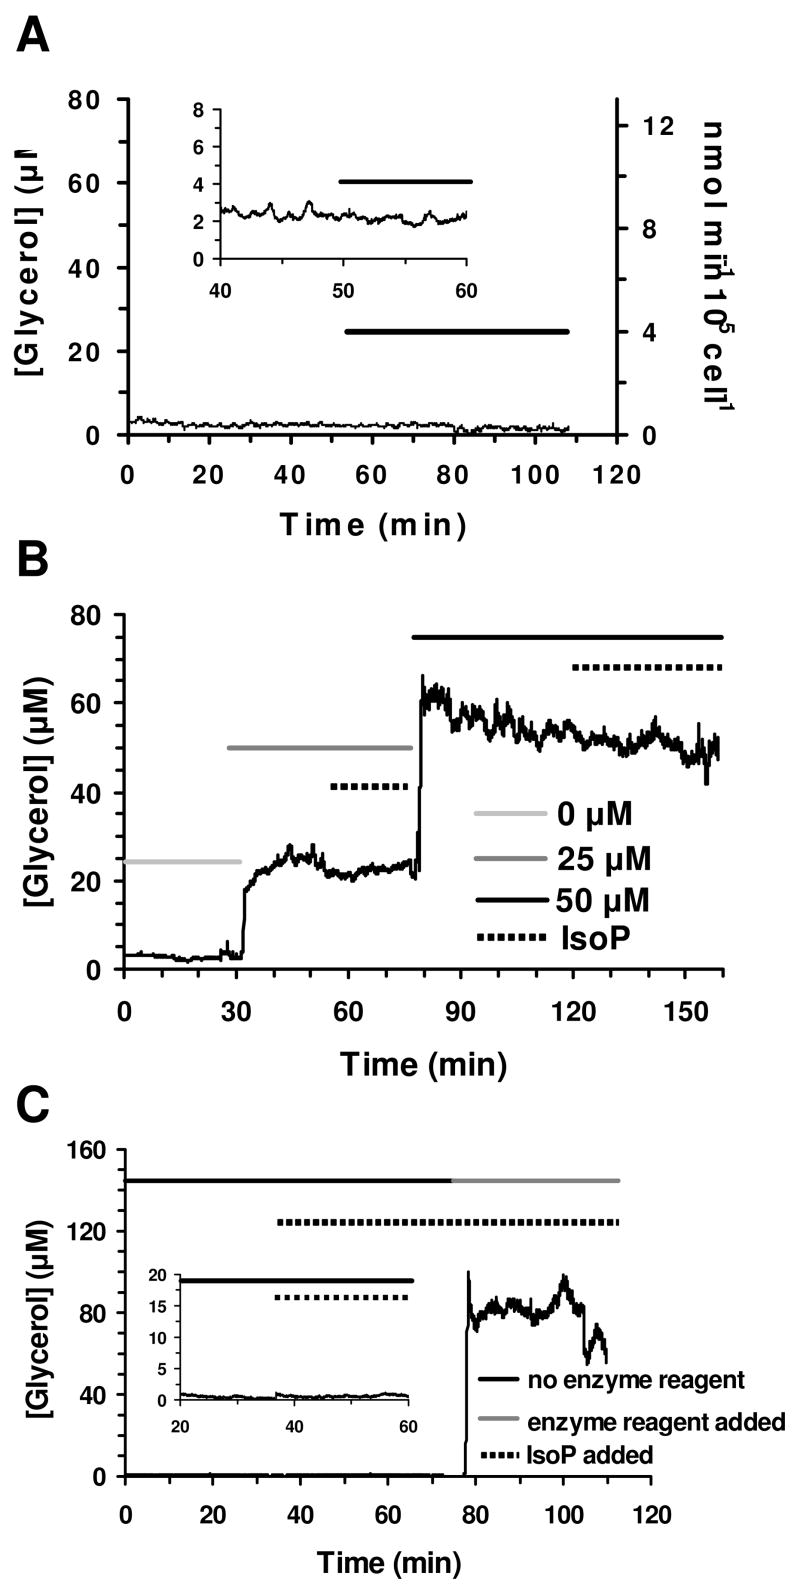
Figure 4.

Control secretion data. (a) Glycerol secretion data was obtained from 95% confluent preadipocytes. The bar indicates perfusion of 20 μM isoproterenol. The y-axis of the insert is 10x greater to enable visualization of the glycerol release measured. (b) The effect of isoproterenol introduction on the on-line enzyme assay was determined to be minimal at both 25 μM and 50 μM glycerol. The light grey line indicates perfusion of 0 μM glycerol standard, medium grey 25 μM, and black 50 μM, respectively. The dashed line represents exposure to 20 μM isoproterenol. (c) The response of the system without the enzyme reagent present and upon inclusion of the enzyme reagent during a cellular secretion experiment was tested. The black and grey lines represent the absence and presence of the enzyme reagent, respectively. The dashed line represents treatment with 20 μM isoproterenol. The y-axis scale of the insert is 8x greater for visualization of the release monitored when isoproterenol was introduced in the absence of the enzyme reagent.
