Figure 3.
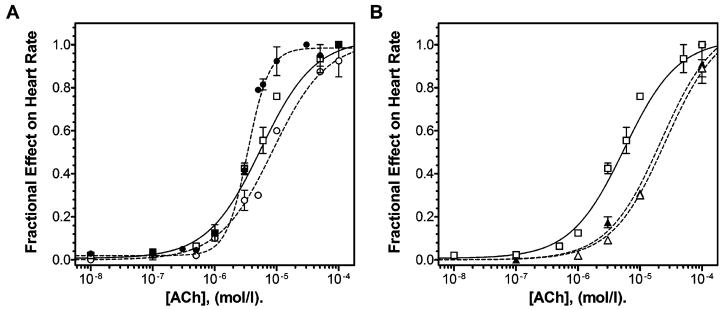
Enhancement of the negative chronotropic response to ACh by human chagasic antibodies in isolated rabbit hearts. (A) Dose-response curves of varying concentrations of ACh (1 × 10⁻⁸ to 1 × 10⁻⁴ mol/L) in the absence (control condition: open squares and continuous line) or presence (filled circles and dashed line) of 1:100 v/v of CChP or NBD sera (open circles and dashed line). (B) Dose-response curves of varying concentrations of ACh (1 × 10⁻⁸ to 1 × 10⁻⁴ mol/L) in the absence (control condition: open squares and continuous line; same set of experiments as in panel A) or presence of gallamine 100 μmol/L (open triangles and dashed line) or the combination of gallamine 100 μmol/L and 1:100 v/v CChP sera (filled triangles and dashed line). Each data point from the curves represents the means ± SEM from three to ten independent experiments with each of the sera from all the CChP or NBD individuals used in the study. The curves were generated from raw data as the shown in Figure 2. pEC50 and Hill slopes were derived from nonlinear regression analysis (see Materials and Methods section for more details).

