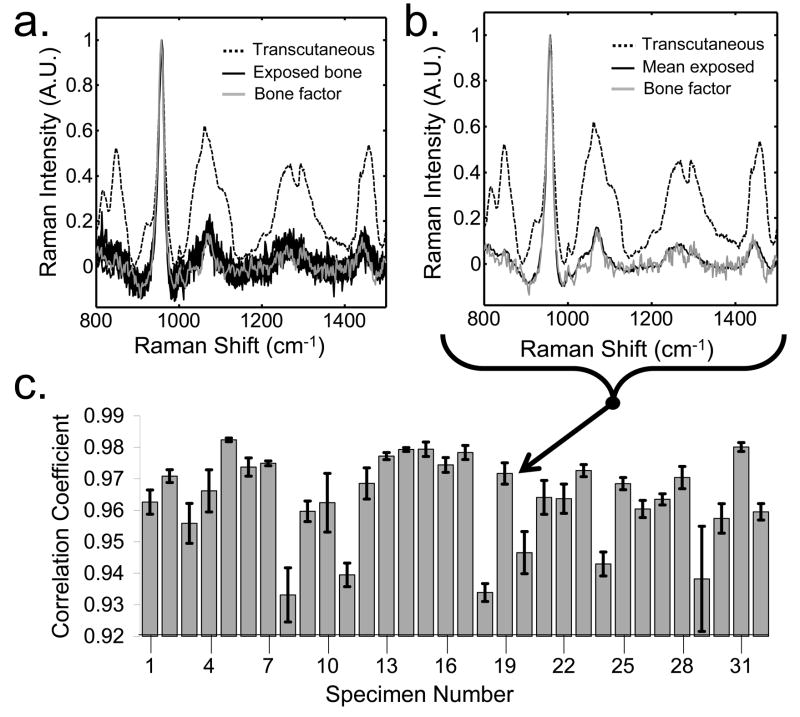
Fig. 6.
Representative recovered bone factor for the in vivo transcutaneous measurements (a) compared to the individual exposed bone spectra and (b) the mean exposed bone spectrum of specimen 19. (c) The recovered bone factors were similar to the mean exposed bone spectra, as evidenced by the high cross-correlation coefficients between the two for all specimens.

