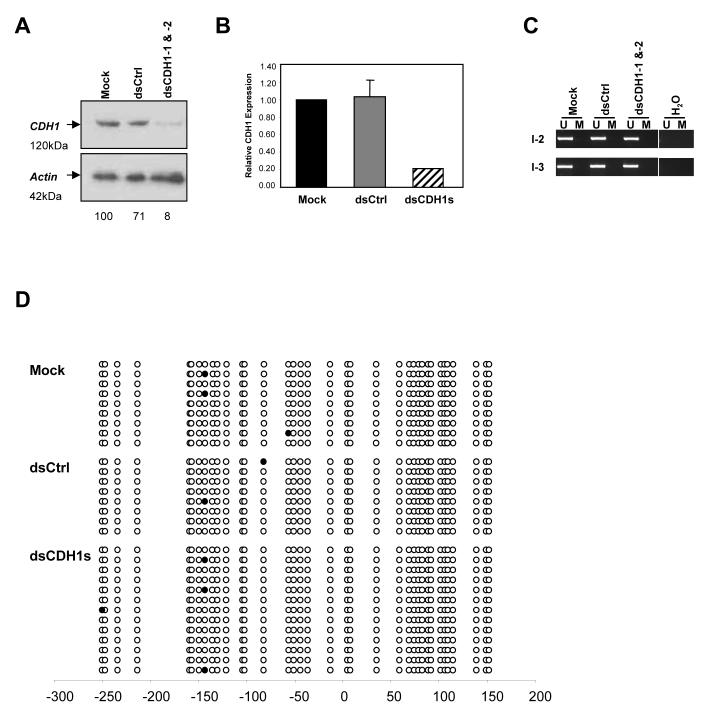
Figure 4.
RdTS is achieved in HCT116 cells genetically lacking both DNMT1 and DNMT3b (DKO) cells. (a) Western blot analysis of DKO cells on day 7 after the mock, dsCtrl, or dsCDH1s treatment for 7 days. CDH1 protein level was decreased to only 8% when compared to the mock treated cells, indicating RdTS was effectively achieved in the absence of two major DNA methyltransferases that are responsible of 95% of the total DNA methylation in these cells.24 (b) qRT-PCR analysis of CDH1 expression in the mock, dsCtrl, and dsCDH1s treated DKO cells. The dsCDH1s treated cells contained only 21±0.00% of CDH1 mRNA when compared to the mock treated HCT116 cells. (c) MSP analysis of the CDH1 promoter in DKO cells treated with the mock, dsCtrl, or dsCDH1s. The MSP pattern of only the U band amplification is preserved in all three treatment groups, indicating a lack of DNA methylation changes. (d) Bisulfite sequencing analysis of the CpG island in the CDH1 promoter in the mock, dsCtrl, and dsCDH1s treated cells on day 7. The CpG sites are shown by their positions relative to the transcription start site (0), the open circles (○) represent unmethylated CpG sites, and closed circles (•) represent methylated CpG sites. The promoter remains unmethylated for each treatment group.

