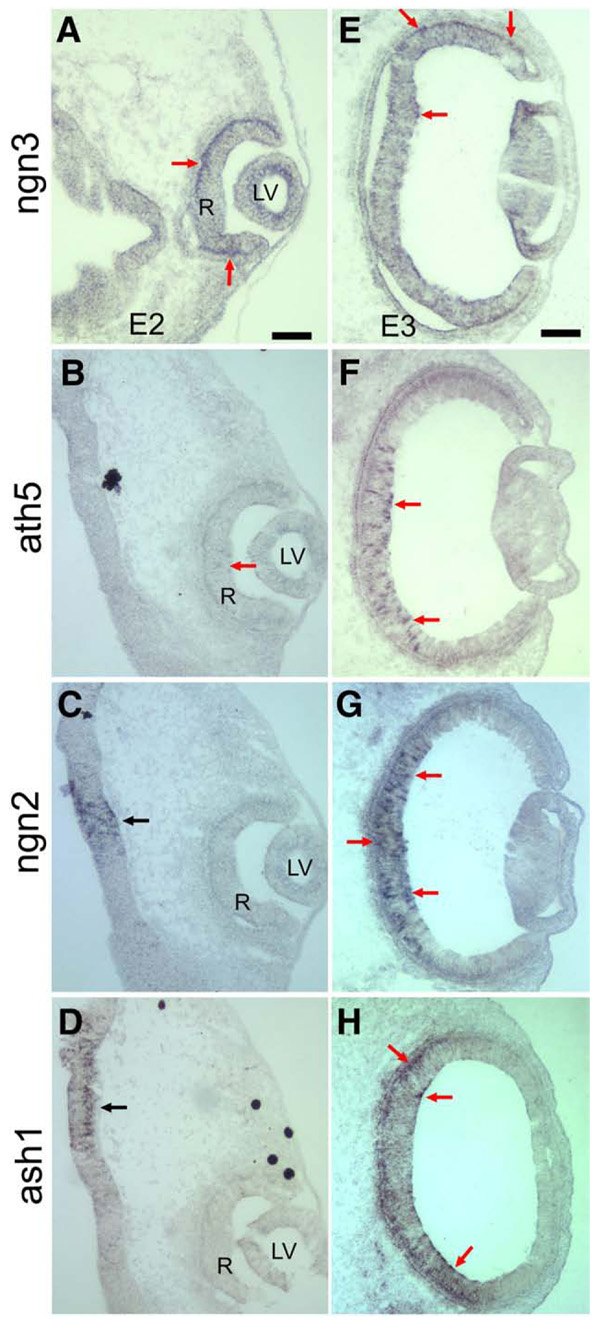
Fig. 4.
A comparison of the expression of ngn3 with the expression of ath5, ngn2, and ash1. (A–D) Serial sections of an E2 embryo showing the expression of ngn3 (A), ath5 (B), ngn2 (C), and ash1 (D). Red arrows point to cells in the retinal neuroepithelium expressing the genes. (E–G) Expression of ngn3 (E), ath5 (F), ngn2 (G), and ash1 (H) in cross-sections of E3 eye. Arrows point to cells expressing the genes. LV: lens vesicle. R: retinal neuroepithelium. Scale bars: 100 µm.

