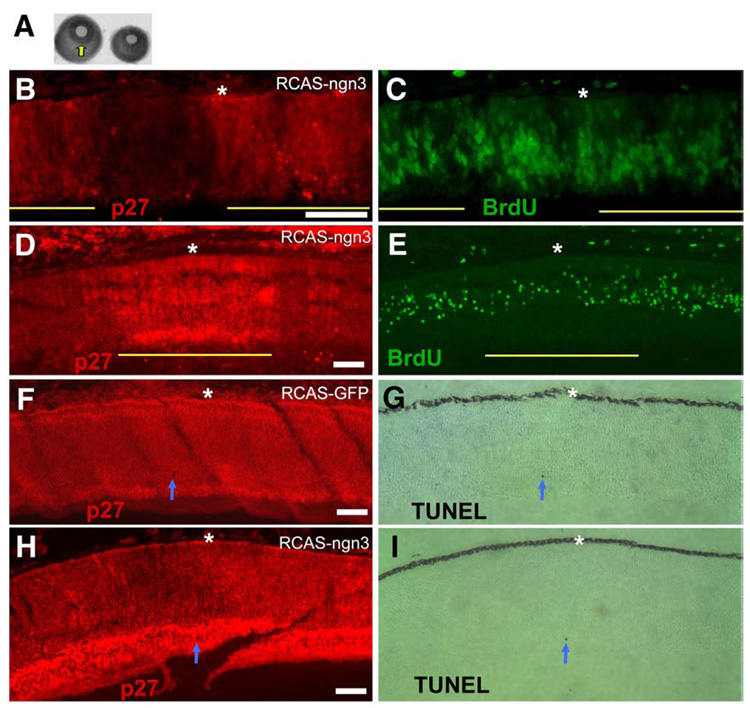
Fig. 5.
Analyses of cell proliferation with BrdU incorporation and of apoptosis with TUNEL assay of retinas infected with RCSA-ngn3. (A) Comparison of the eye size at E7.5 between a normal (left) and an experimental eye (right). Arrow points to the well-formed iris, which is missing in the experimental eye. (B, C) Double-labeling for an RCAS viral protein, p27 (B) and for BrdU incorporation (C) of an E5 retina with partial infection by RCAS-ngn3. The anti-p27 staining was used to identify regions, indicated by yellow lines, which were infected by the virus. (D, E) Double-labeling for the viral protein p27 (D) and for BrdU incorporation (E) of an E7.5 retina with partial infection by RCAS-ngn3. Yellow line indicates the infected region. (F, G) Double-labeling for the viral protein p27 (F) and for TUNEL+ cells (G) of an E7.5 retina infected with RCAS-GFP. Arrow points to a TUNEL+ cell. (H, I) Double-labeling for the viral protein p27 (H) and for TUNEL+ cells (I) of an E7.5 retina infected with RCAS-ngn3. Arrow points to a TUNEL+ cell. Scale bars: 50 µm.

