Fig. 6.
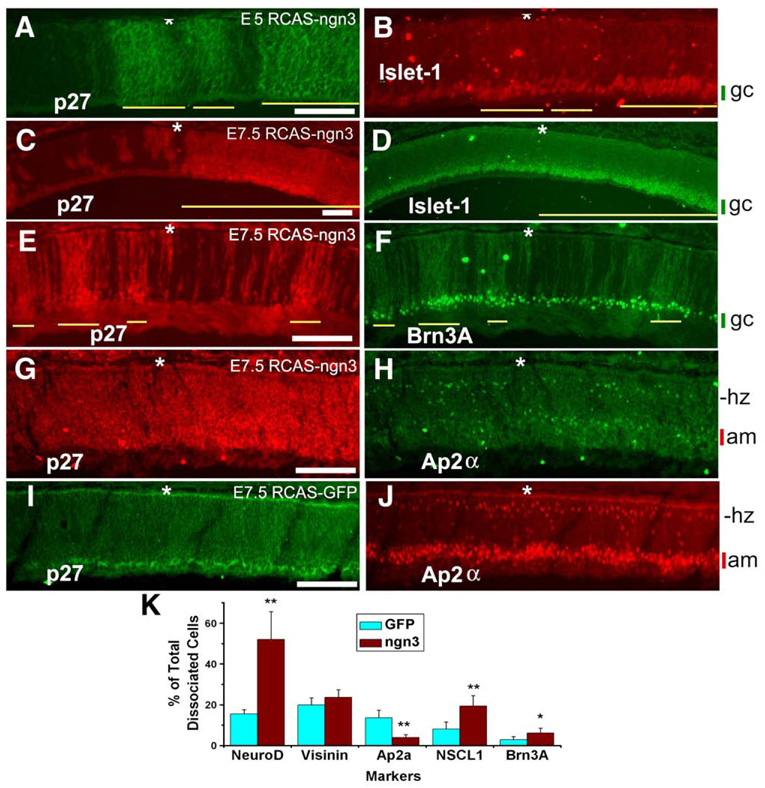
Alterations in retinal neurogenesis from ngn3 overexpression. (A, B) Double-labeling for RCAS viral protein p27 to identify infected regions (yellow line) by RCAS-ngn3 (A) and for Islet-1 (B) of E5 retina partially infected by the virus. (C, D) Double-labeling for viral protein p27 (C) and Islet-1 (D) of E7.5 retina partially infected with RCAS-ngn3. Yellow line indicates the infected region. (E, F) Double-labeling for viral protein p27 (E) and Brn3A (F) of E7.5 retina partially infected with RCAS-ngn3. Yellow line indicates the infected region. (G, H) Double-labeling for viral protein p27 (G) and Ap2α (H) of E7.5 retina infected with RCAS-ngn3. (I, J) Double-labeling for viral protein p27 (I) and Ap2α (J) of control E7.5 retina infected with RCAS-GFP. The cellular (presumably ganglion cells, gc) layer that increased in thickness upon ngn3 overexpression is marked by a green vertical bar, whereas the layer (presumably amacrine cells, am) with reduced thickness is marked by a red bar. The prospective location of horizontal cells (hz) is marked for convenience. The RPE layer is indicated by an asterisk. (K) A quantitative analysis of different cell populations using dissociated retinal cells from retinas infected with RCAS-GFP (GFP) or RCAS-ngn3 (ngn3). Shown are the means ± SDs of the calculated percentage of cells identified with each marker among dissociated E7.5 retinal cells. * and ** indicate statistical significance at 0.05 and 0.01 levels, respectively. Scale bars: 100 µm.

