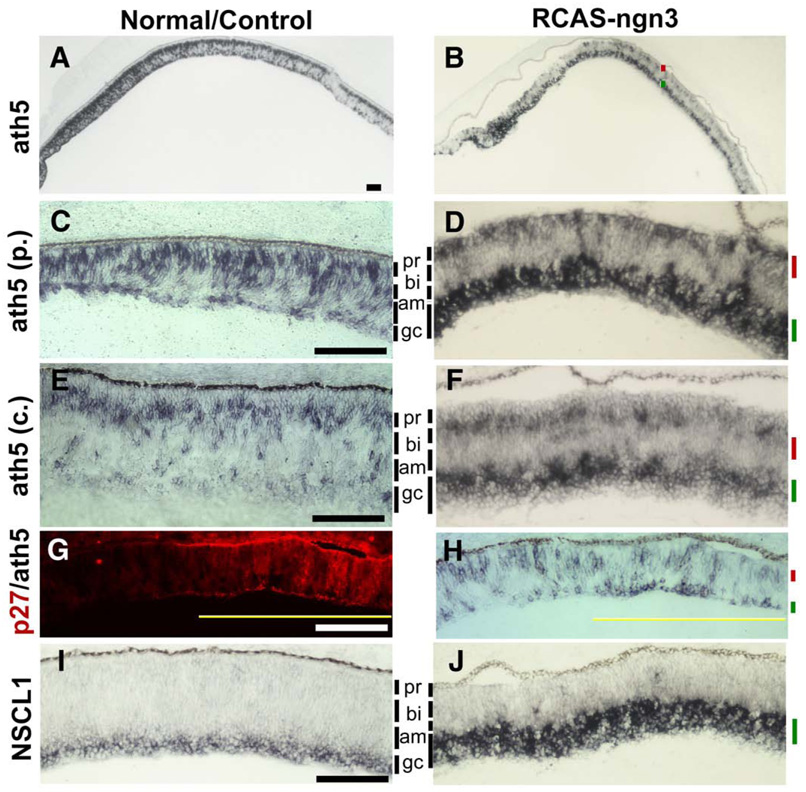
Fig. 7.
Alterations in the spatial patterns of ath5 and NSCL1 expression in retinas infected by RCAS-ngn3. (A, B) Low magnification views of in situ hybridization for ath5 mRNA in normal retina (A) and experimental retina at E7.5 (B). (C, D) ath5 expression in a peripheral region of the control retina infected with RCAS-GFP (C) and in the experimental retina at E7.5 (D). (E, F) ath5 expression in a central region of the control retina infected with RCAS-GFP (E) or experimental retina (F). (G, H) Double-labeling for RCAS viral protein p27 (G) and ath5 expression (H) of E5 retina partially infected with RCAS-ngn3. Yellow line indicates the infected region. (I, J) The spatial expression patterns of NSCL1 in normal (I) and experimental (J) retinas. The cellular layer with diminished gene expression is marked by a red bar. The cellular layer with increased gene expression is marked by a green bar. To facilitate visualization of the pseudo-stratification of the E7.5 retina, the prospective cell layers are indicated by vertical lines in gray and marked for prospective positions of photoreceptors (pr), bipolar (bi), amacrine (am), and ganglion cells (gc). Scale bars: 100 µm.

