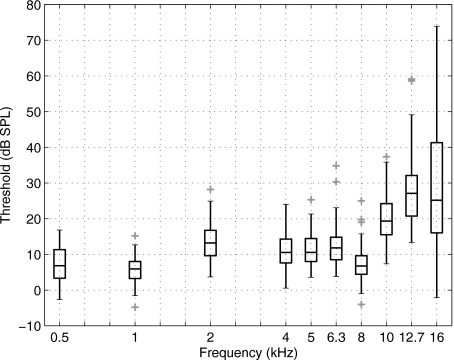
Figure 11.
ML thresholds expressed as the incident SPL at the threshold (i.e., the SPL on each tone burst that would be measured in the anechoic tube), as referenced to the calibration of the ER10‐B+ and ER-2 earphones in the no-extension probe condition. These thresholds are shown as a box and whiskers plot, with each outlier plotted using a plus symbol (+).

