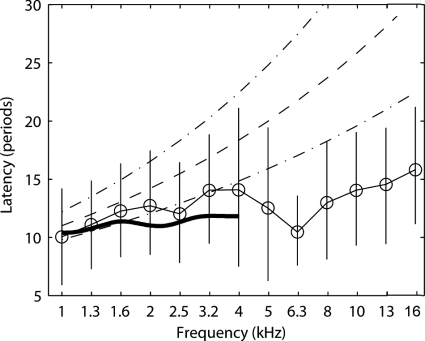
Figure 7.
Group means of CEOAE latency (thin solid lines and open circle symbols) are plotted nondimensionally in units of the number of periods at the filter center frequency. Data are for CEOAEs recorded at the highest stimulus level (73 dB peSPL). Vertical error bars indicate the latencies at the half-power bandwidths of the envelope peaks. The broken lines show the mean and 95% confidence intervals of SFOAE latencies reported by Shera et al. (2002) for stimulus levels of 40 dB SPL. The thick solid line shows the mean latencies of SFOAE latencies reported by Schairer et al. (2006) for stimulus levels of 40 dB SPL [variability not plotted for clarity but are shown in Schairer et al. (2006)].

