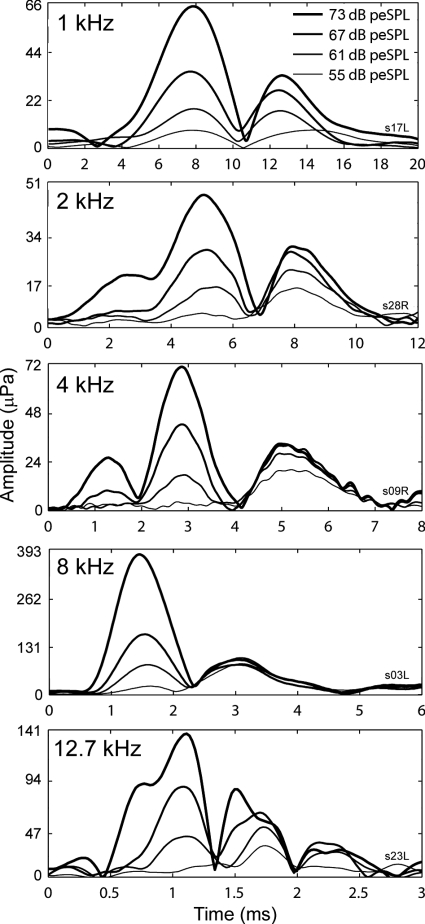
Figure 8.
1∕3-octave filtered CEOAE waveform envelopes as a function of time and stimulus level. Panels show increasing filter center frequency (kHz). The tracings in each panel are from a different subject. The plotting axes in each panel encompass different ranges to allow the examination of salient details. No synchronized spontaneous OAEs were present in the data shown.

