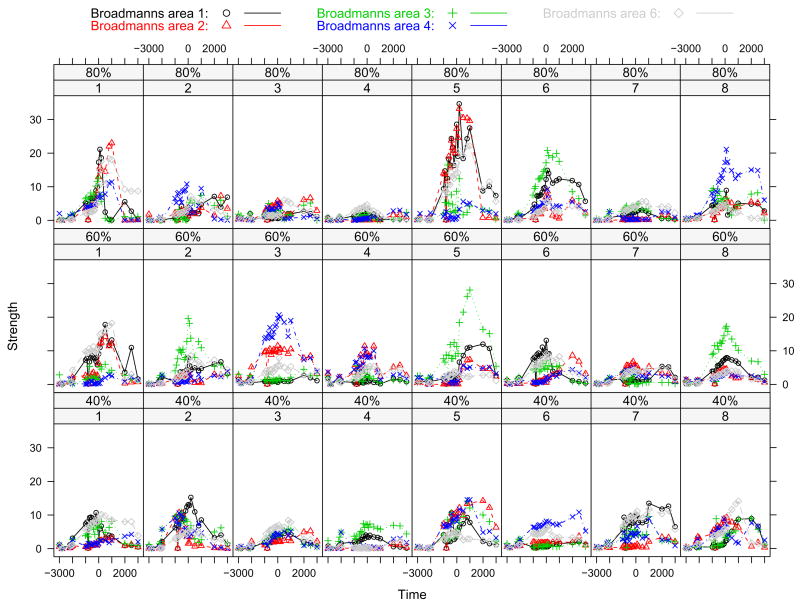
Figure 2.
Source strength versus time for eight subjects by different force level. Source strengths for five different cortical areas under same condition are plotted within one sub-plot by different symbols. Broadmanns area 1, 2, 3, 4, and 6 are denoted by circle with black, triangle with red, plus with green, cross with blue, and diamond with gray, respectively.

