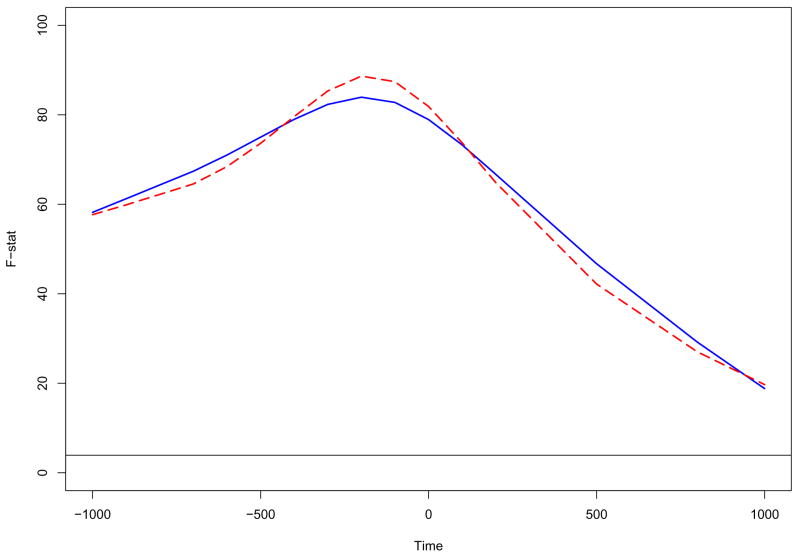
Figure 4.
Functional ANOVA plot for the grand mean function μ(t) based on the different methods: the solid curves are estimated from the two-step method and the dashed curves are estimated from the regression spline method. The horizontal line indicates the 5% signification level for the F-distribution with 1 and 145 degrees of freedom.

