
Fig. 1.
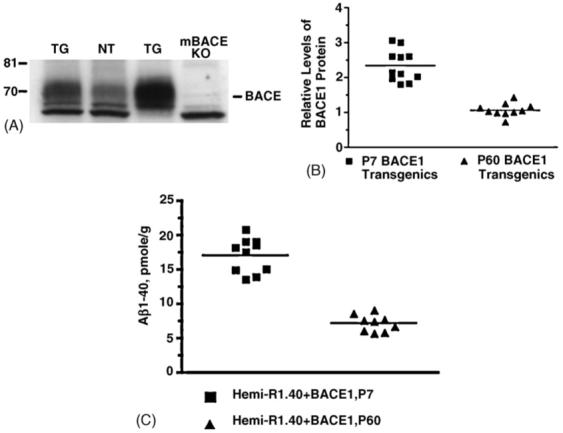
Human BACE1 expression and Aβ production in neonatal and adult BACE1 transgenic mice. (A) Western blot analysis of mouse and human BACE1 in 1% CHAPS brain extracts. Twenty micrograms of total protein from adult BACE1 transgenic in lane 1 (TG), adult nontransgenic control in lane 2 (NT), 1-week-old BACE1 transgenic in lane 3 (TG), and mouse Bace1 KO in lane 4 (mBACE KO) mice were run on 8% Tris-glycine gels, transferred to polyvinylidene difluoride membrane, and blotted with C-terminal antibody BACE-00/6. On the left for each gel are sizes of molecular weight markers in kilodaltons. (B) BACE1 protein expression was quantified by comparing the amount of BACE1 protein in post-natal day 7 (P7) BACE1 transgenics (n = 11) and post-natal day 60 (P60) BACE1 transgenics (n = 10) brain tissue extracts relative to a standard curve of Bace1 expression using a fluorescence imager for capture of chemiluminescent signal. Human BACE1 is expressed ∼2-fold higher in P7 transgenic animals compared to P60 transgenic animals (two-tailed t-test with Welch’s correction, p-value < 0.0001). (C) Brain extracts from BACE1/R1.40 YAC APP double transgenic animals were analyzed by Aβ1-40 ELISA. P7 double transgenic animals (n = 10) had significantly higher levels of Aβ1-40 compared to P60 double transgenic animals (n = 9) (two-tailed t-test with Welch’s correction, p-value < 0.0001).