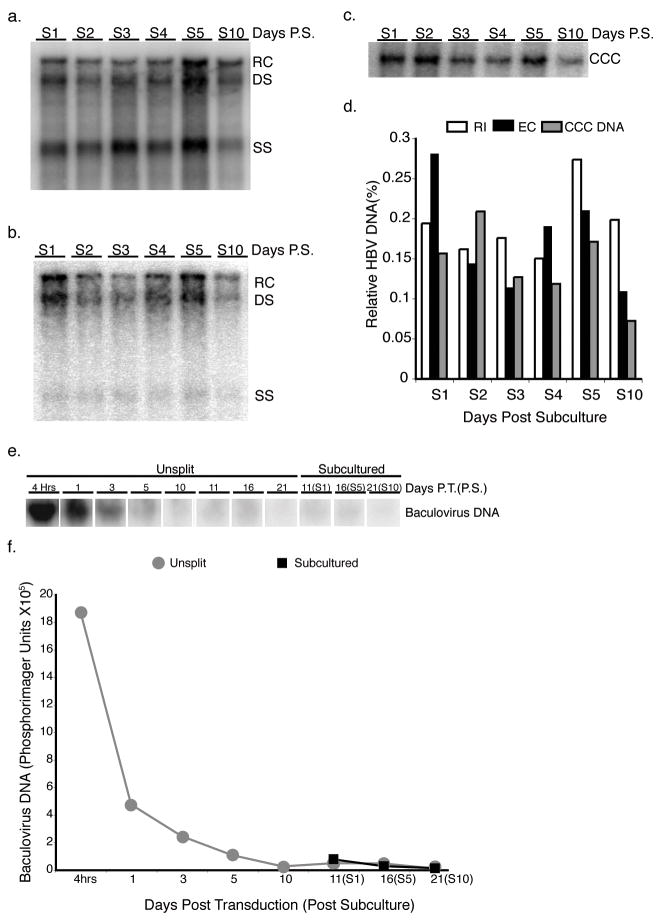
FIG. 4. Southern blot analysis of subcultured HBV-infected HepG2 cells and analysis of baculovirus DNA.
HBV RI (a), EC (b) and CCC (c) DNAs were extracted from HepG2 cells that were subcultured 1:4 10 days post-initiation of HBV replication with a HBV-expressing baculovirus at the time points indicated. (d) Quantification of the various HBV DNA species. Levels of HBV DNA in subcultured cells were standardized to day 10 unsplit cells. The relaxed circular (RC), double stranded (DS) and single stranded (SS) bands are indicated. Input baculovirus DNA was extracted from subcultured and unsplit HepG2 cells at the times indicated and analyzed by Southern blot. Image of Southern blot (e) and quantification of baculovirus input DNA (e).

