Figure 2.
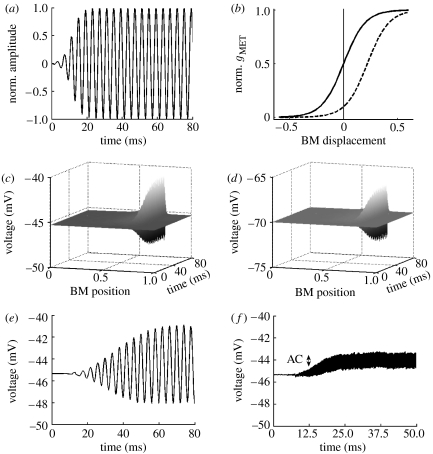
Input–output relations of the model. (a) The normalized 250 Hz acoustic signal of 80 ms duration as the model input. (b) The normalized mechanoelectrical transducer channel activation as a function of BM displacement for both OHCs (solid curve) and IHCs (dashed curve). The activation gMET is described by the Boltzmann function gMET=gMET,max/(1+exp(−(x−x0)/d)), where x is the displacement of the BM (all units in μm), x0 is the BM displacement at which the MET channel is half activated (0 and 0.22 for OHCs and IHCs, respectively) and d determines the width of the transition range. For both OHCs and IHCs, d=0.1 (Kennedy et al. 2005). (c) The time course of the IHC receptor potential (the node 2, , in figure 1b) along the cochlear axis in response to a 250 Hz stimulus. The BM position is divided into 300 cross sections longitudinally coupled, extending from the cochlear base (BM position=0) to the apex (BM position=1). (d) Similar to (c) but for OHCs (the node 3, , in figure 1b). (e,f) The time course of the receptor potential at IHCs tuned to 250 and 5000 Hz, respectively. The AC voltage component attenuates with increasing frequency (from 3.4 mV at 250 Hz to 1.1 mV at 5000 Hz, or 9.6 dB attenuation). A similar behaviour is observed in the experimental data (Palmer & Russell 1986). Predicted responses in this and subsequent figures correspond to the acoustic stimulus of relatively low intensity (20–40 dB), allowing the linear approximations in the model.

