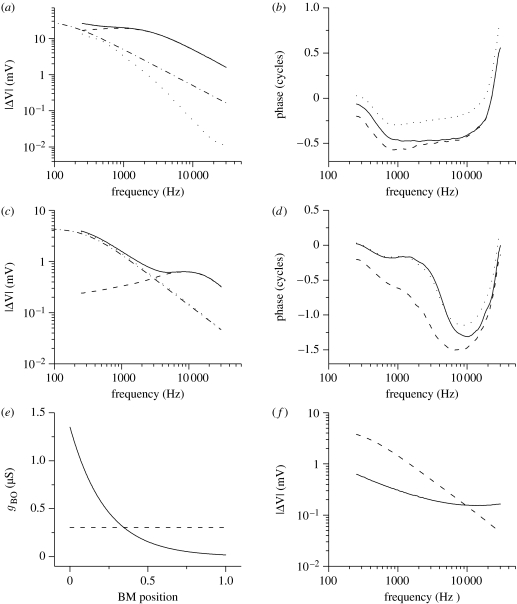
Figure 4.
Frequency-domain simulations. (a) The IHC gain function, representing the IHC receptor potential at the best frequency and how it varies with that frequency. (b) The accumulation of the IHC phase lag at the best frequency. For each frequency point, the phase lag accumulated at the characteristic position is displayed. Lags for intracellular, extracellular and transmembrane potentials are plotted. (c) The OHC gain function. (d) The accumulation of the OHC phase lag at the best frequency. Solid curve, intracellular potential; dashed curve, extracellular potential; dotted curve, transmembrane; dot-dashed line, single cell potential. (e) Assumed dependence of the OHC basolateral conductance gBO on the cochlear tonotopic position. gBO was kept either constant (gBO=300 nS) as in the time-domain simulations or varied exponentially from gBO=1200 nS at cochlear base (BM position=0) to gBO=25 nS at apex (BM position=1) as observed experimentally (Mammano & Ashmore 1996). OHC apical resistance was treated similarly. (f) The OHC transmembrane gain function is shown for variable basolateral and for constant OHC conductance. Dashed curve, constant conductance; solid curve, variable conductance.

