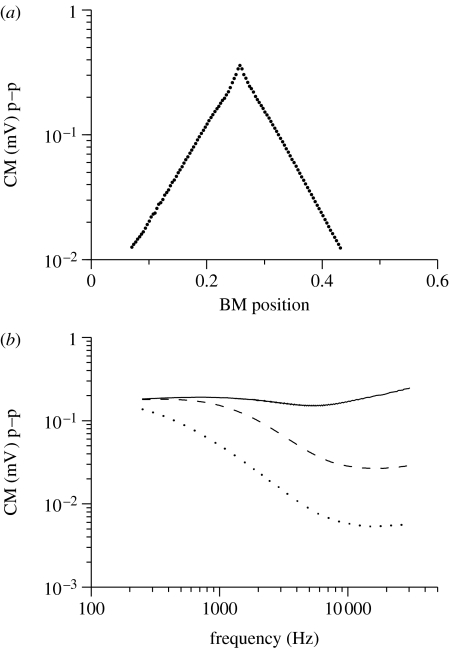
Figure 6.
The longitudinal spread of the CM. The CM is the stimulus-driven extracellular potential at node 1 in figure 1b (scala media). The input was a BM displacement pattern with unity magnitude at a single cross section corresponding to the best frequency=17.9 kHz, and 0 for all other sections. Peak-to-peak (p–p) CM amplitudes are plotted. (a) The magnitude of the CM decays exponentially along the cochlea with the space constant of 1 mm. (b) The dependence of the CM amplitude on the frequency of the sound stimulus and on the magnitude of the total capacitance of the non-sensory cells in the stria vascularis CSV. Solid curve, 0.1 nF; dashed curve, 1 nF; dotted curve, 5 nF.

