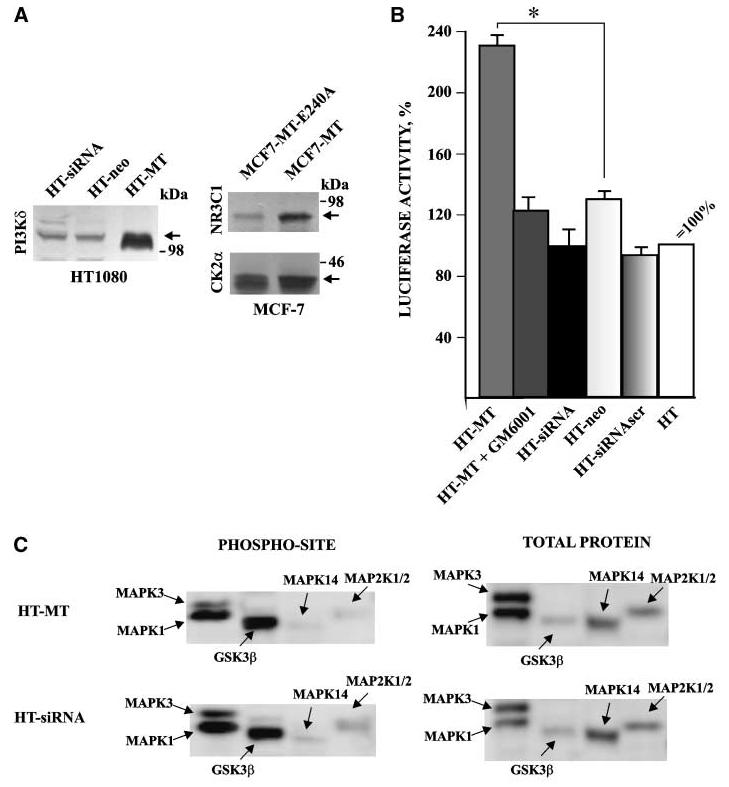
Figure 3.

The transactivation function of MT1-MMP. A, Western blotting of HT1080 (left) and MCF-7 cells (right) with the PI3Kδ,NR3C1, and CK2α antibodies. The incubation with the primary antibody was followed by the species-specific HRP-conjugated secondary antibody and a TMB/M substrate. Note the up-regulation of the target genes in cells expressing MT1-MMP-WT. Arrows point to the PI3Kδ,NR3C1, and CK2α bands. B, transient expression assay of the transcriptional activity of the NR3C1 promoter-luciferase chimera. HT, HT-neo, HT-MT, HT-siRNA, and HT-siRNAscr cells were each transiently transfected with both the NR3C1 promoter–firefly luciferase chimera and the pGL4.74 control vector that carried the Renilla luc gene under the control of the thymidine kinase promoter. The mean of four measurements was taken to obtain the firefly luciferase activity that was expressed as relative units defined by the ratio of firefly luciferase to Renilla luciferase activity. Where indicated, cells were coincubated for 14 h with GM6001 (50 μmol/L) before activity measurement. The activity measured in the parental HT cells was taken as 100%. Columns, mean of at least three independent transfection experiments; bars, SE. The data are statistically significant (P < 0.05). C, phosphorylated site and total protein screening. HT-MT and HT-siRNA cell lysate samples were analyzed using phosphorylated site and total kinase protein screening. A portion of the Western blot image that included pMAPK1, pMAPK3, pMAPK14, pMAP2K1/2, and GSKβ (a control). Normalized cpm of pMAPK1 (T185/Y187), pMAPK3 (T202/Y204), pMAPK14 (T180/Y182), pMAP2K1/2 (S217/S221), and GSKβ(Y216) in HT-MT/HT-siRNA cells is 2040/3940, 620/1250, 80/230, 130/430, and 2900/2600, respectively. Normalized cpm of MAPK1, MAPK3, MAPK14, MAP2K1/2, and GSKβ total protein in HM-MT/HT-siRNA cells is 2290/960, 2190/1240, 1410/1370, 720/760, and 420/390, respectively. Normalized cpm is the trace quantity of the band normalized to a 60-s scan time. Values represent the average of the duplicate determinations performed by Kinexus.
