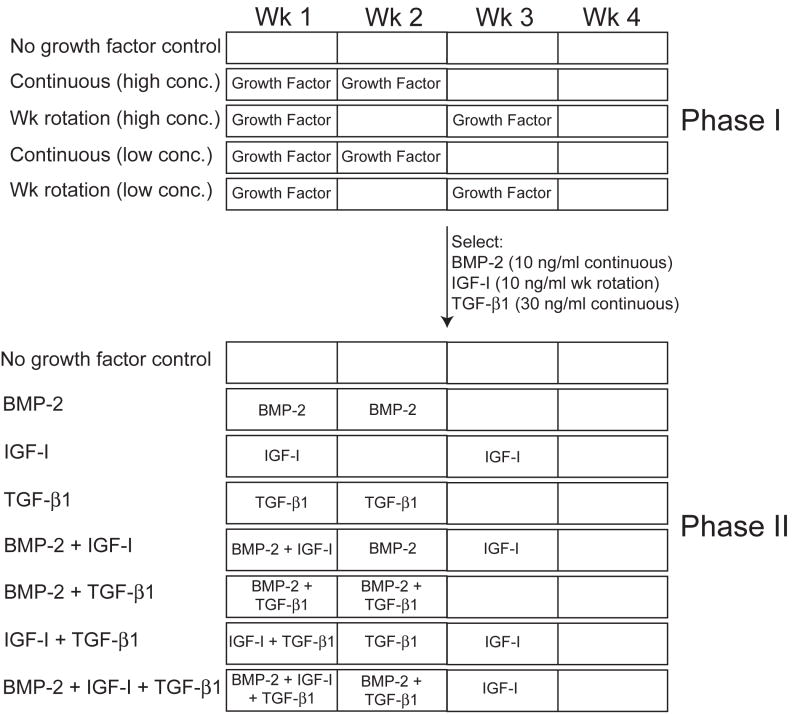
Fig. 1.
Schematic diagram indicating experimental designs of phases I and II. The experimental design depicted in phase I was carried out for each individual growth factor separately (blocked by growth factor). The best treatment for each growth factor was selected for phase II. Phase II assessed the effects of each growth factor individually and in all combinations of two and three.

