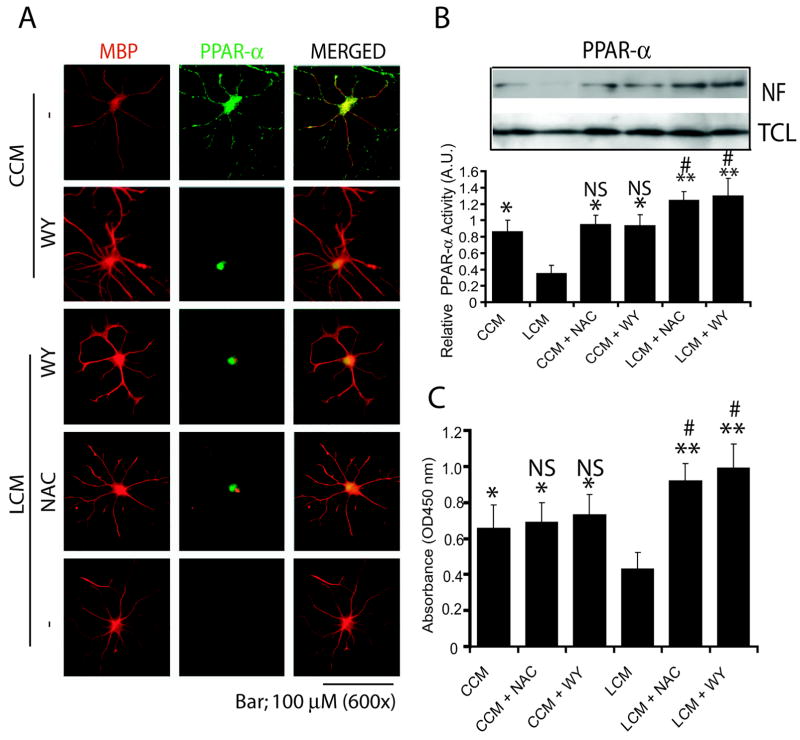
Figure 4. Similar to WY14643 (WY), NAC attenuates LCM-induced inhibition of PPAR-α trans-activation in the developing OLs.
Developing OLs were pretreated with WY (20 μM) or NAC (10 mM) for 30 min and 2 h, respectively, prior to culturing in LCM or CCM. Field of representative slides of double-immunostained for MBP/PPAR-α depicts the nuclear translocation of PPAR-α in the developing OLs at 2 h of post-treatment (A). Likewise, representative immunoblot autoradiogram depicts the level of PPAR-α in the nuclear fraction (NF) including total cell lysates (TCL) of the developing OLs after 2 h of treatment as described above (B, insert). Plot depicts relative activity of PPAR-α determined with respect to level of nuclear PPAR-α and total PPAR-α in the cell lysate as determined by densitometric analysis of immunblot autoradiogram (n=3) and data is presented as arbitrary units (A.U.) (B). Plot depicts PPAR-α activity in the nuclear extract of similarly treated developing OLs for 2 h determined by ELISA based assay from three identical experiments (C). Statistical significance is indicated *p< 0.05 and **p<0.01 versus LCM and # p<0.05 and NS (non-significant) versus CCM.

