
Figure 2.
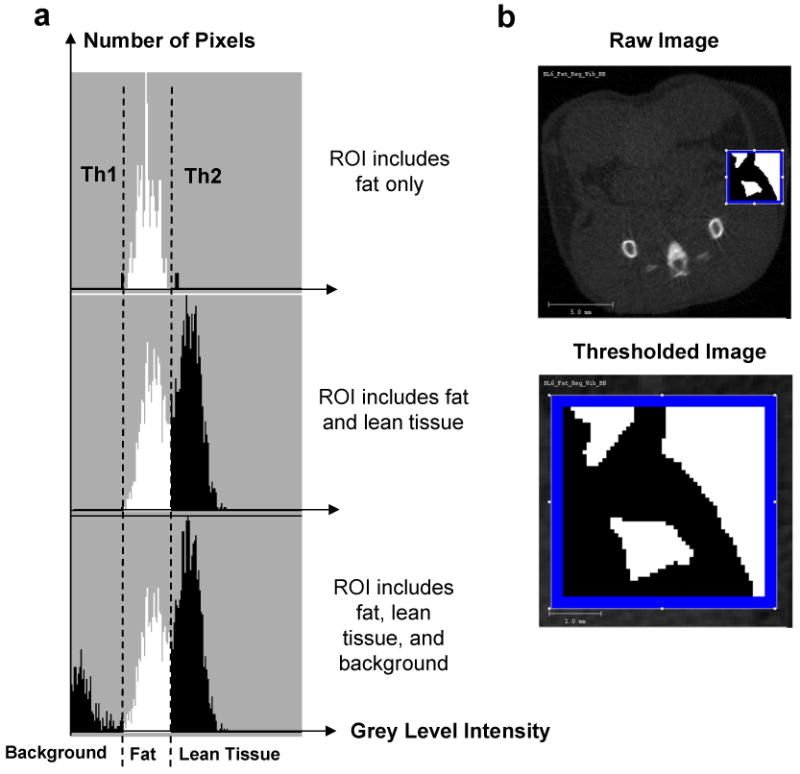
Selection of threshold values for each tissue type to separate fat and bone from other tissues. (a). Representative regions of interest (ROI) of known composition were selected. Histograms of the gray-level intensities (x-axis) within these representative ROIs were generated. The top histogram presents a histogram for a ROI in which only one tissue type (fat) was present. The relatively homogenous fat tissue is represented by a narrow distribution of gray level intensities (densities), allowing the selection of an upper and lower thresholds (Th1 and Th2) specific for fat. For the histogram below, an ROI was selected in which two tissue types - fat and lean tissue (muscles and/or internal viscera) – were present, causing a bimodal intensity distribution. The bottom histogram shows a trimodal distribution of density values from a ROI with two tissue types and background. (b). A reconstructed image from the mid-torso areas was utilized in the selection of the ROI with known tissue types (top). The enlarged image (bottom) provides an example for a ROI which yields a bimodal distribution.