
Figure 3.
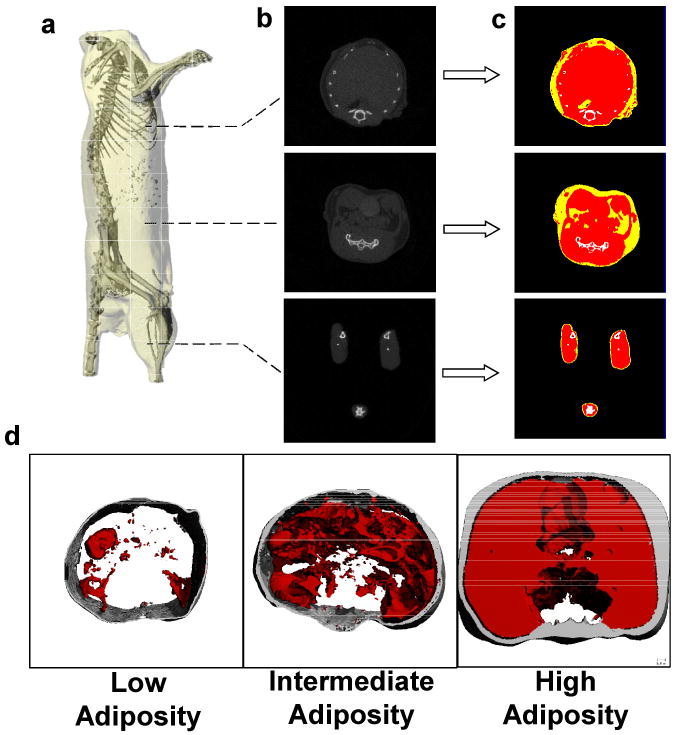
(a) Reconstructed microCT scan of a mouse in which the skeleton can be readily identified to define the region of interest. (b). The majority of the adipose tissue in the mouse is localized in the abdominal region, as the thoracic cavity and legs show lower prevalence of low density (fat) tissue. (c). To quantify fat volume in these different body compartments, tissues of different density were segregated and categorized as either fat (yellow) lean mass (red) or bone (white). (d). Representative images from three different animals with either low, intermediate, or high adiposity. Subcutaneous fat is shown in gray, visceral fat in red.