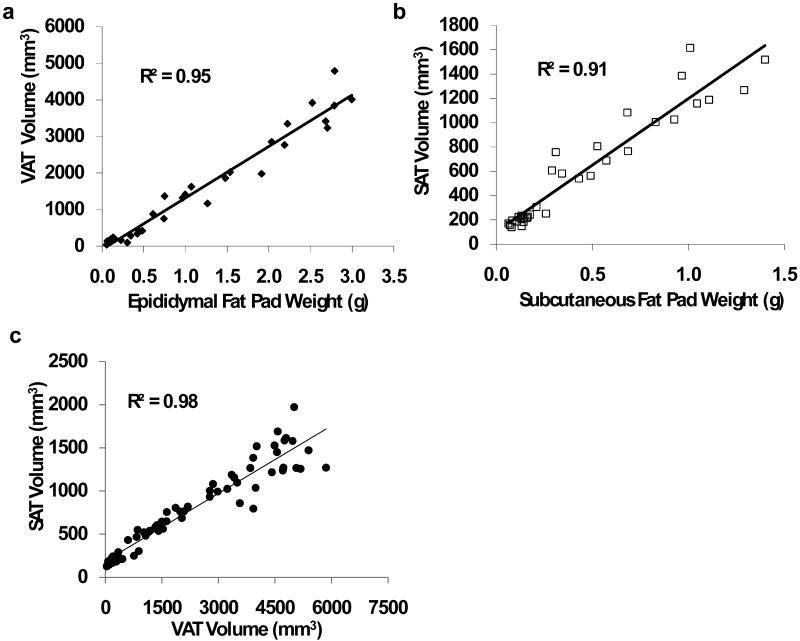
Figure 5.
Evaluation of abdominal adiposity separating visceral adipose tissue (VAT) from subcutaneous adipose tissue (SAT). For these analyses, data from 45 animals were randomly selected from the entire population. (a). Visceral adipose tissue volume was highly correlated with the weight of the visceral (perigonadal) fat pad (p<0.001). (b). Subcutaneous adipose tissue volume was highly correlated with the weight of the subcutaneous (from the lower back) fat pad (p<0.001). (c). As the microCT calculated volumes for both fat deposits correlated well with the weights of the respective fat pads, VAT and SAT area were also correlated to each other (p<0.001).

