
Figure 1. Patient Utilities for Diabetic Complications and Treatments.
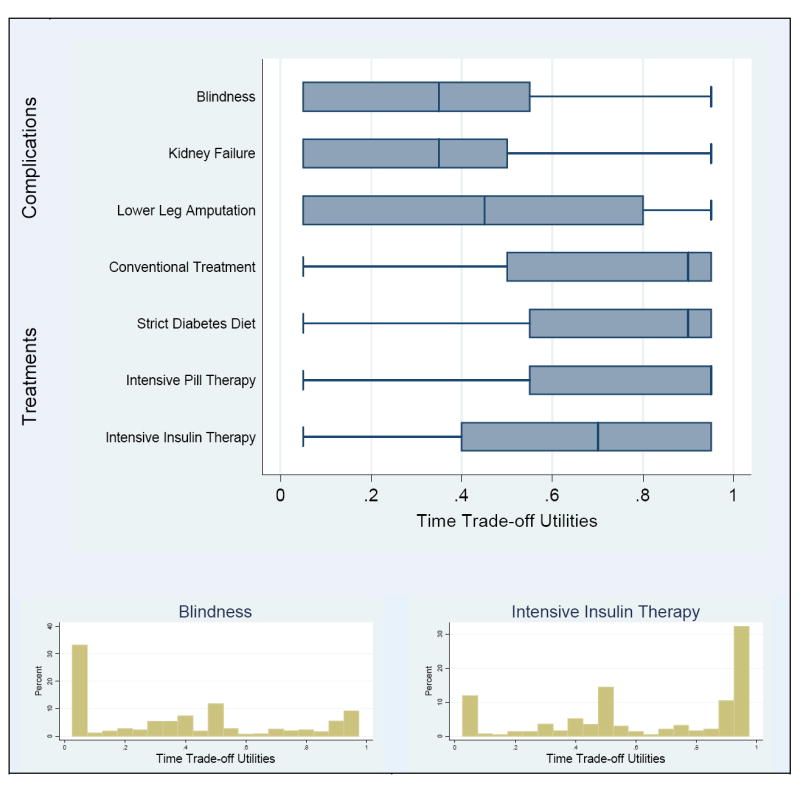
Boxplots of time trade-off utilities (TTOs) for diabetes complications and treatments reveal broad patterns of their distributions, which facilitates comparison. The detailed features in the histograms for blindness and intensive insulin therapy are typical of the TTO distributions for diabetes complications and treatments, respectively. The fact that utilities of 0 and 1 were not observed is an artifact of the algorithm for eliciting them. In the boxplots, the vertical line within the box represents the median value, and the edges of the box are the first and third quartiles. The lines extending from the edges of the box end at the last value within 1.5 times the interquartile range (third minus first quartile) from the edge of the box. Any values beyond this distance are considered outliers and are plotted individually.