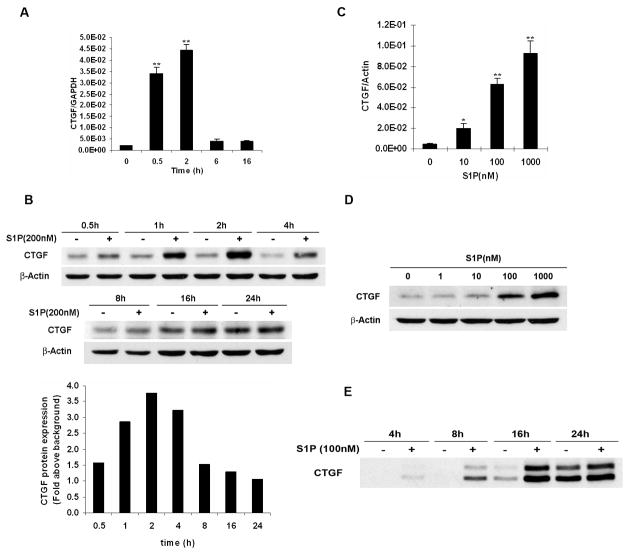
FIGURE 1.
S1P induced CTGF expression and secretion in WiT49 cells. A and B. WiT49 cells were serum starved for 24 h and then treated with S1P for different time before quantitative real-time PCR (A, 100 nM S1P) or western blot analysis (B, 200 nM S1P) was done. **, P < 0.01 versus control (0 h). Relative ratio in B represents the fold induction of CTGF by S1P treatment compared to that in non-treatment control at each different time point. CTGF expression was normalized to the housekeeping gene β-Actin. C and D. WiT49 cells were serum starved for 24 h and then treated with different concentrations of S1P for 1 h before quantitative real-time PCR (C) or western blot analysis (D) was done. *, P < 0.05, **, P < 0.01 versus non-treatment control. E. Conditioned media of WiT49 cells were collected and prepared as in Materials and Methods, and followed by western blot analysis.

