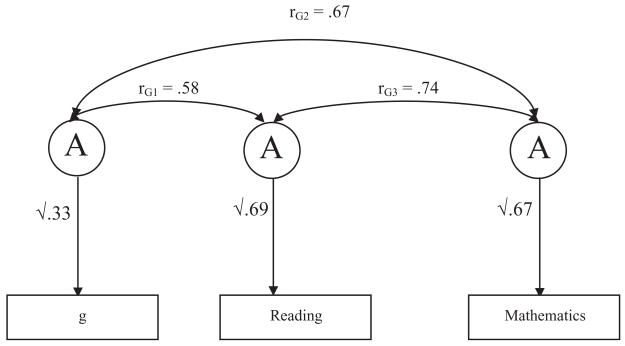
Fig. 3.
Proportions of the total variance attributable to genetic influences for each trait are indicated by the paths leading from the latent genetic factors to the measured traits. Correlations between the latent genetic influences on each trait (transformed Cholesky parameters) are denoted by rG and are represented by the double-headed arrows.

