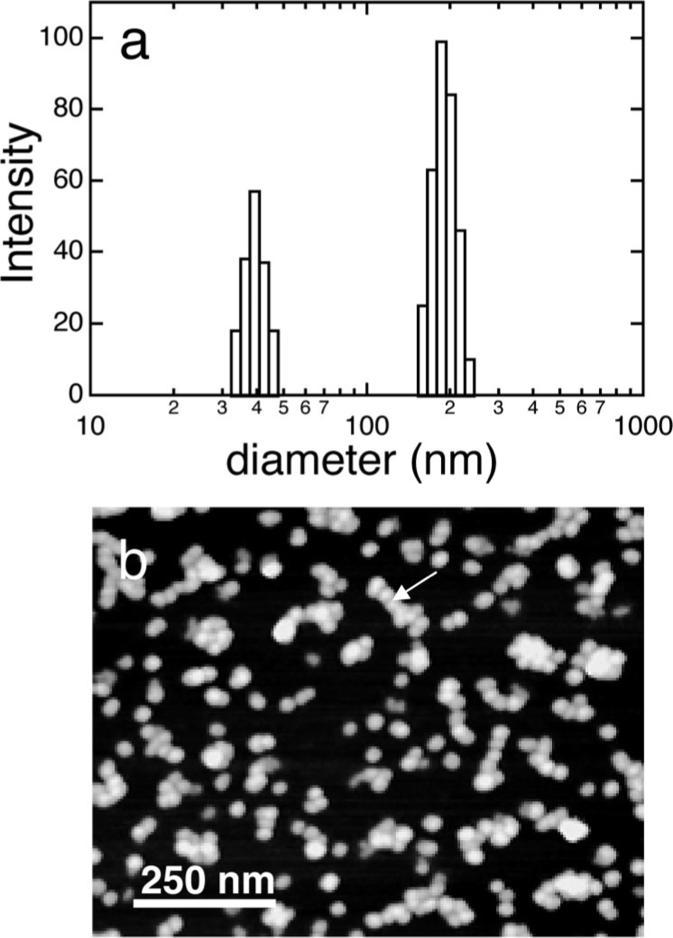
Figure 1.
(a) DLS-determined size distribution of rp(H)M180 134 μg/mL solution at pH 8 showing peaks at 37.5 and 177 nm. (b) AFM image of protein solutions mixed with a fixative and dropped onto mica showing individual nanospheres and clusters of nanospheres (see arrow). The fixative method preserves the structures of the nanospheres in solution.

