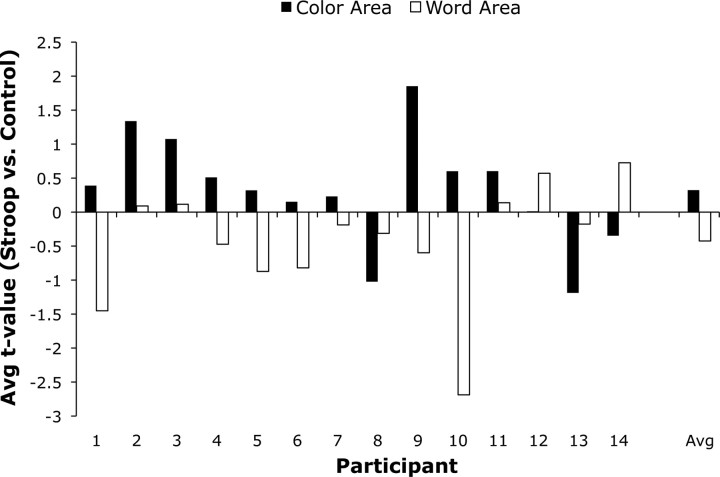
Figure 5.
Average t value for the Stroop versus neutral contrast in the color (black bars) and word areas (white bars) of individual participants. Activity in the color area tended to be enhanced while activity in the word area tended to be suppressed. The group averages are presented on the right of the figure.

