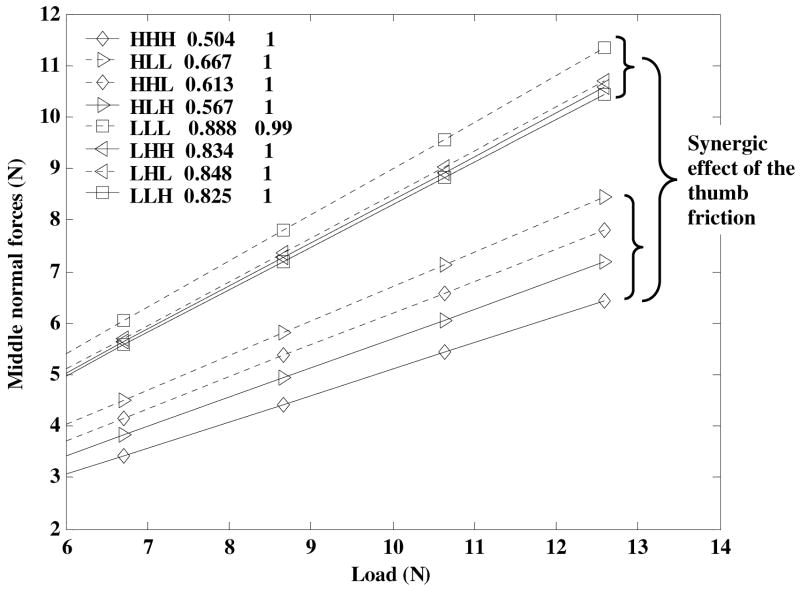
Figure 13.
Dependence of the middle finger normal force on the load for different friction sets. Group averages are shown. The numbers in the figure are the coefficients and the coefficients of correlation squared (all r2≥0.98). The dotted lines designate the low friction contact at the middle finger. The two groups of the regression lines were mainly distinguished by the friction at the thumb (the synergic effect). The two small figure brackets show the local friction effect, i.e. the force variations induced by the high or low friction contact at the middle finger. At a given thumb friction, the forces were larger at the low friction contact at the middle finger. Adapted by permission from Niu X, Latash ML, and Zatsiorsky VM (2007) Prehension synergies in the grasps with complex friction patterns: local vs. synergic effects and the template control. Journal of Neurophysiology (in press).

