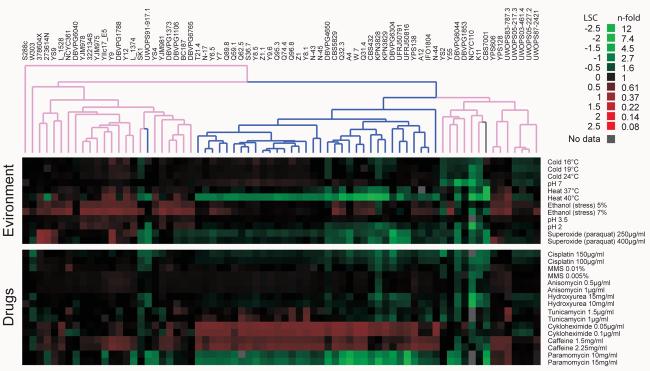
Fig. 4. Saccharomyces phenotype variation.
A selection of growth phenotypes for S. cerevisiae and S. paradoxus strains in different environments and drugs. The complete set of lag, rate and density phenotypes in 67 environments is displayed in Fig. S9. Phenotypes were quantified using high-resolution micro-cultivation measurements of population density. Strain (n=2) doubling time (rate) phenotypes in relation to the S288c derivative BY4741 (n=20) are displayed. Green = poor growth, red = good growth. Hierarchical clustering of phenotypes was performed using a centered Pearson correlation metric and average linkage mapping. Blue = S. paradoxus, pink = S. cerevisiae, grey = S. bayanus isolate CBS7001.

