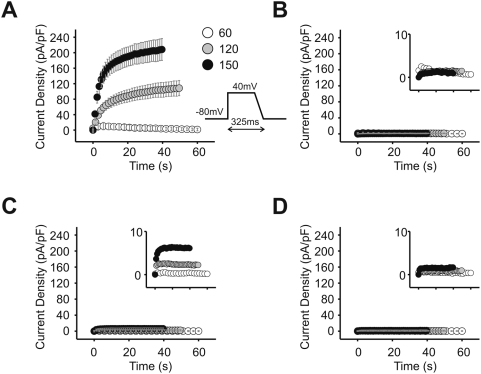
Figure 6. KCNE1-D76N and KCNE1-Δ70 mutations result in defective rate-related accumulation of IKs current.
A series of 100 pulses mimicked action potential trains at three rates: 60, 120, or 150 per minute. On the voltage protocol, the grey stripe indicates the 10 ms over which the current measured was averaged and plotted on the graphs. The insets for B, C, and D show the Y-axis magnified and the points plotted without error bars. X- and Y-axes labels are the same as the main graph. A) Cells transfected with KCNQ1 (Q1) and wild-type KCNE1 (E1); depolarization length 325 ms. B) Cells transfected as in A, but depolarization length of voltage protocol adjusted as follows: 60 pulses/min-325 ms; 120 pulses/min-175 ms; 150 pulses/min-145 ms. C) Cells transfected with Q1 and E1-D76N; depolarization length 325 ms. D) Cells transfected with Q1 and E1-Δ70; depolarization length 325 ms. n = 6.

