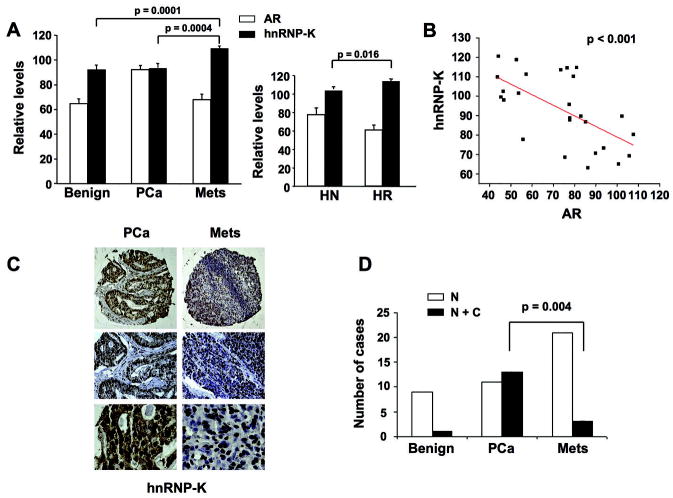
Figure 5.
Quantitative analysis of hnRNP-K and AR levels in a human prostate TMA. (A) Relative levels of hnRNP-K and AR as assessed by ChromaVision analysis of TMA containing benign, local PCa, and metastatic tumors (left panel). The right panel shows averaged values of hnRNP-K and AR in the metastatic subset (HN: hormone naïve; HR: hormone resistant). (B) Regression analysis showing a significant inverse correlation between hnRNP-K and AR in organ-confined tumors. (C) Representative micrographs showing hnRNP-K expression and subcellular localization. Note the loss of cytoplasmic staining in the metastatic tissue (lower right panel). (D) The graph shows the number of cases among the different diagnostic groups with predominant nuclear (N) or nuclear + cytosolic (N+C) staining. PCa, organ confined prostate cancer; Mets, metastases.

