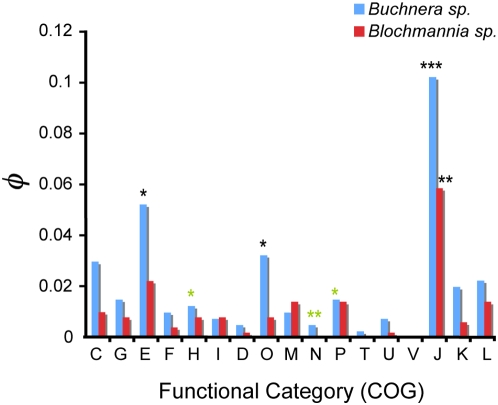
Figure 2. Distribution of highly constrained genes among the functional categories in Buchnera sp. (blue bars) and Blochmannia sp. (red bars).
The different functional categories as explained by the Cluster of Orthologous Groups (COG) are represented in the X-axis. The height of the bar represents the relative contribution of each class (i) of size (t), to the total number of genes under strong selective constraints (ni: R(ω) = ωe/ωf<1) when considering the whole dataset (T). This normalized number hence was calculated as φ = (ni/t) * (t/T). Classes showing significant enrichment with highly constrained genes under a hypergeometric distribution are labeled by (*, P<0.05; **, P<10−2; ***, P<10−3). We also labeled those functional classes significantly underrepresented by highly constrained genes using green stars.

