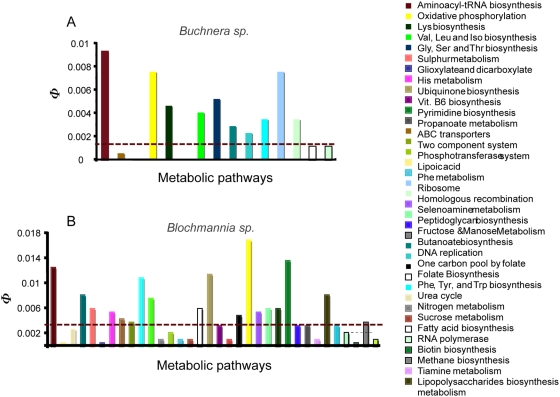
Figure 4. Distribution of genes under functional divergence among the metabolic pathways significantly enriched or impoverished with these genes in Buchnera (A) and Blochmannia (B).
The different metabolic classes are color-coded. Dotted line separates metabolic pathways enriched with functionally divergent genes (above the line) from those impoverished with these genes (below the line). The height of the bar represents the relative contribution of each class (i) of size (t), to the total number of genes under functional divergence (ni: R(ω) = ωe/ωf<1) when considering the whole dataset (T). This normalized number hence was calculated as φ = (ni/t) * (t/T).

