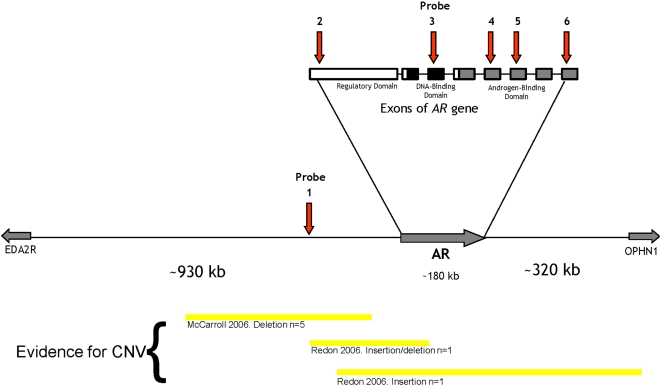
Figure 1. Location of the probes in relation to the androgen receptor.
Diagrammatic representation of part of chromosome × showing the androgen receptor (AR) and the upstream (EDA2R) and downstream (OPHN1) genes. The relative locations of the upstream region (probe 1) and the five probes within the exons of AR are represented by the arrows. The AR gene exons are represented as boxes, as is the location of prior evidence of copy number variation (CNV) in this region.

